
Learning to interpret stock charts and chart patterns is an indispensable skill for anyone serious about trading or investing. For the uninitiated, the myriad of lines, bars, and candlesticks flickering across the screen can feel overwhelmingly complex. Don’t worry—this guide is designed to demystify technical analysis and provide you with the essential knowledge you need to start making sense of market movements.
By the end of this comprehensive guide, you’ll not only understand the fundamental components of stock charts but also how to spot basic yet powerful chart patterns and leverage key technical indicators to make smarter, more informed decisions in the financial markets.
Understanding the Key Components of a Stock Chart: Your Visual Data Toolkit
Every stock chart is a rich tapestry of information, providing crucial insights into past price action and potential future market trends. Here’s what you need to know about its core elements:
1. Candlesticks: The Language of Price Action
(Image Integration 1: image_dbf522.jpg - A clear diagram of a bullish (green) and bearish (red) candlestick, clearly labeling Open, High, Low, Close, Body, and Wicks.)
Candlesticks are arguably the most popular and visually intuitive way to visualize stock price movements. Each "candle" represents the price action over a specific timeframe (e.g., one minute, five minutes, an hour, a day, a week, or a month), condensing four critical data points into a single, easy-to-read shape:
Open Price: The price at which the stock began trading during that period.
Close Price: The price at which the stock finished trading for that period.
High: The highest price reached during the timeframe, represented by the top of the "wick" or "shadow."
Low: The lowest price reached during the timeframe, represented by the bottom of the "wick" or "shadow."
The body of the candlestick represents the range between the open and close prices. The thin lines extending from the body are called "wicks" or "shadows," indicating the high and low prices reached.
Green (or White) Candle (Bullish): Typically means the stock closed higher than it opened, signaling buying pressure. A long green body suggests strong bullish momentum.
Red (or Black) Candle (Bearish): Typically means the stock closed lower than it opened, signaling selling pressure. A long red body suggests strong bearish momentum.
The length of the body and wicks can also convey information. Short bodies with long wicks might indicate indecision, while long bodies suggest strong directional movement.
2. Volume: The Fuel Behind Price Movements
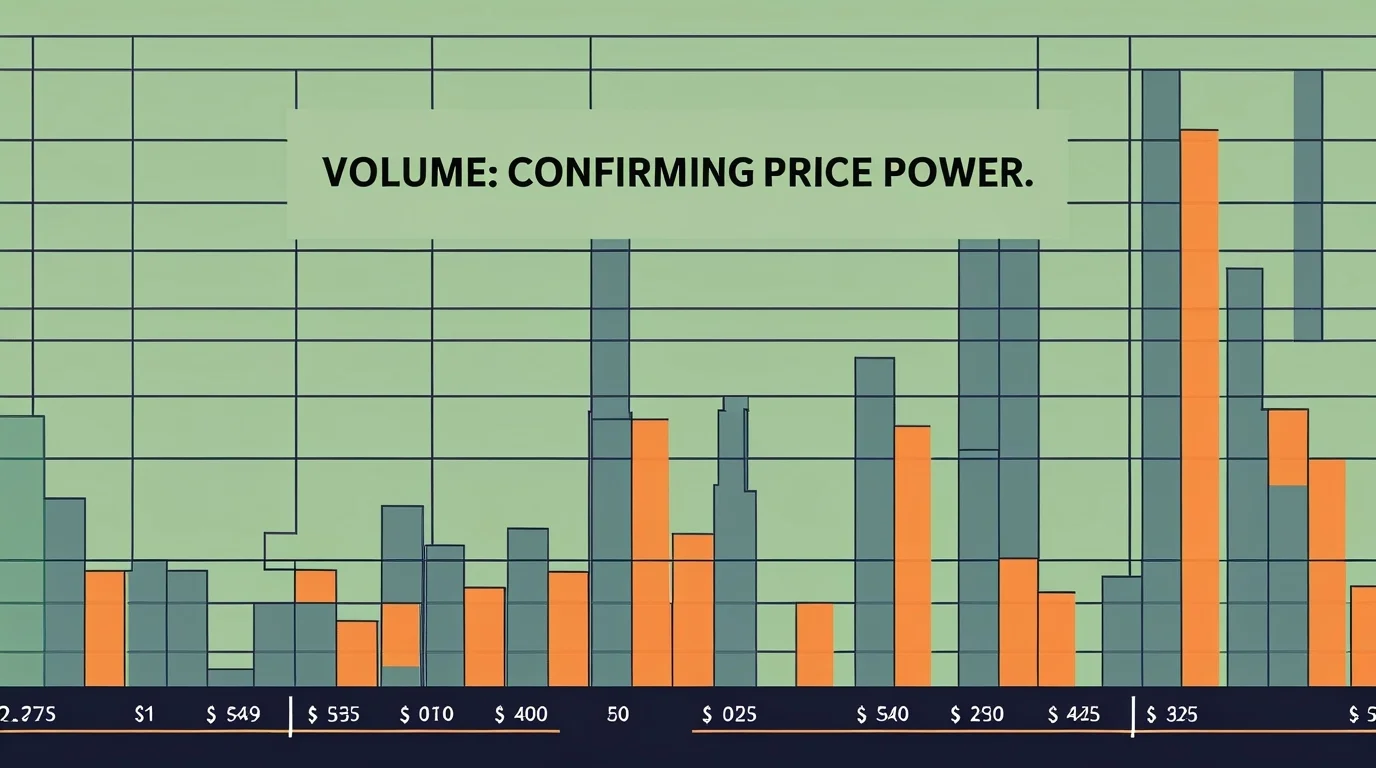
Volume displays the total number of shares of a stock that were traded (bought and sold) during a specific period. It is typically shown as a bar graph at the bottom of the stock chart, directly below the candlesticks.
Volume is a crucial indicator of investor interest and conviction.
High Trading Volume: Often signals strong investor interest and can confirm the strength of a price movement. For example, if a stock price makes a significant upward move on exceptionally high volume, it strongly suggests that the move is supported by real buying demand and is more likely to continue.
Low Trading Volume: Might suggest weak momentum or a lack of conviction behind a price movement. A price rise on low volume could indicate that the move is not widely supported and might be prone to reversal.
Volume Spikes: Sudden, dramatic increases in volume often accompany major news events (earnings reports, product launches, analyst upgrades/downgrades) and can lead to significant price volatility.
Understanding volume helps you gauge the conviction behind price changes, adding a vital layer of confirmation to your technical analysis.
3. Moving Averages: Smoothing Out the Noise
(Image Integration 2: image_dbf4be.jpg - A stock chart showing multiple moving average lines (e.g., 20-day, 50-day, 200-day) flowing through the candlesticks.)
Moving Averages (MAs) are lines plotted directly on a stock chart that smooth out price data over a specific timeframe, making it easier to identify underlying market trends by filtering out short-term price fluctuations ("noise"). They act as dynamic support and resistance levels.
The two most common types of moving averages are
Simple Moving Average (SMA): This is the arithmetic mean of closing prices over a set number of periods (e.g., a 50-day SMA calculates the average closing price over the past 50 trading days). It gives equal weight to all prices in the period.
Exponential Moving Average (EMA): The EMA places more weight on recent prices, making it more responsive to new information and therefore better at capturing shorter-term movements and quicker trend changes.
How to Use Moving Averages:
Trend Identification:
If the price is consistently above a moving average and the moving average is sloping upwards, it indicates an uptrend.
If the price is consistently below a moving average and the moving average is sloping downwards, it indicates a downtrend.
Support and Resistance: Moving averages often act as dynamic support levels (where prices tend to bounce up from in an uptrend) or resistance levels (where prices tend to fall from in a downtrend).
Crossovers (Buy/Sell Signals):
Golden Cross (Bullish Signal): A shorter-term moving average (e.g., 50-day SMA) crosses above a longer-term moving average (e.g., 200-day SMA), often signaling a new uptrend.
Death Cross (Bearish Signal): A shorter-term moving average crosses below a longer-term moving average, often signaling a new downtrend.
Moving averages are fundamental tools for understanding the prevailing market trend and identifying potential reversal or continuation points in a stock’s price.
Spotting Basic Stock Chart Patterns: Predicting Price Direction
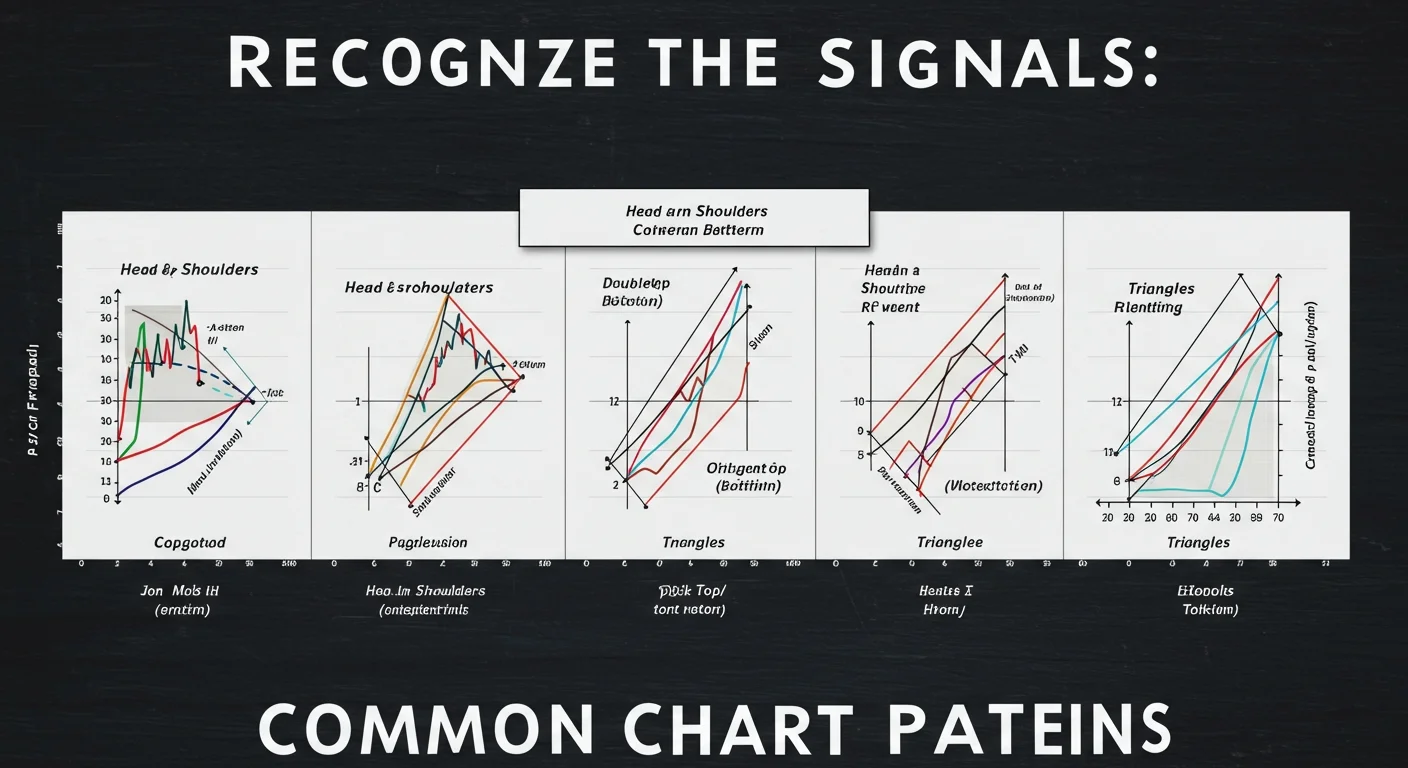
Stock chart patterns are recurring formations on price charts that often suggest predictable future price movements. They are visual representations of market psychology and the battle between buyers and sellers. Here are three beginner-friendly patterns to watch for:
1. Head and Shoulders (Reversal Pattern)
The head and shoulders pattern is one of the most reliable reversal patterns, typically found at the top of an uptrend (signaling a bearish reversal) or at the bottom of a downtrend (inverse head and shoulders, signaling a bullish reversal).
Formation (Regular Head and Shoulders - Bearish Reversal):
Left Shoulder: A price peak followed by a small decline.
Head: A higher price peak than the left shoulder, followed by a decline to roughly the same level as the previous decline.
Right Shoulder: A lower price peak than the head, followed by a decline.
Neckline: A line connecting the lowest points of the two declines (between the shoulders and the head).
Signal: When the price breaks below the neckline on increased volume, it suggests a strong bearish reversal, meaning the price is likely to drop significantly.
Inverse Head and Shoulders (Bullish Reversal): The opposite formation, found at the bottom of a downtrend, signaling a potential uptrend.
2. Double Top and Double Bottom (Reversal Patterns)
These patterns also signal a potential reversal in the prevailing trend.
Double Top (Bearish Reversal):
Formation: The price rises to a resistance level, pulls back, then rises to roughly the same resistance level again, and then starts to fall. It forms an "M" shape.
Signal: When the price breaks below the low point between the two tops (the "confirmation line" or "neckline"), it indicates a potential downward trend.
Double Bottom (Bullish Reversal):
Formation: The price falls to a support level, bounces up, falls back to roughly the same support level again, and then starts to rise. It forms a "W" shape.
Signal: When the price breaks above the high point between the two bottoms, it signals a potential upward trend.
These patterns are relatively easy to recognize and can be very useful for predicting changes in price direction.
3. Triangles (Continuation or Reversal Patterns)
Triangle patterns occur when a stock's price range narrows, creating a triangular shape as price highs and lows converge. They can signal either a continuation of the current trend or a potential reversal.
Ascending Triangle (Typically Bullish):
Formation: Characterized by a flat resistance level (straight horizontal line at the top) and a rising support level (upward-sloping line at the bottom).
Signal: Suggests buyers are more aggressive, pushing the price up against resistance. A breakout above the flat resistance line signals a likely uptrend continuation.
Descending Triangle (Typically Bearish):
Formation: Characterized by a flat support level (straight horizontal line at the bottom) and a falling resistance level (downward-sloping line at the top).
Signal: Suggests sellers are more aggressive, pushing the price down against support. A breakdown below the flat support line signals a likely downtrend continuation.
Symmetrical Triangle (Neutral/Continuation):
Formation: Characterized by a converging pattern of both lower highs and higher lows, creating a symmetrical triangle shape.
Signal: Indicates a period of consolidation or indecision. The breakout (either up or down) from the triangle typically signals the direction of the next significant move, often a continuation of the prior trend.
Technical Indicators for Beginners: Adding Layers of Confirmation
Technical indicators are mathematical calculations based on a stock's price, volume, or both, plotted on a stock chart to help traders analyze past performance and predict future price movements. While there are hundreds, these three are excellent for beginners and provide valuable insights:
1. Relative Strength Index (RSI)
Purpose: The RSI is a momentum oscillator that measures the speed and change of price movements. It helps assess whether a stock is overbought (potentially due for a pullback) or oversold (potentially due for a bounce).
Range: It's displayed as a single line fluctuating between 0 and 100.
Signals:
Above 70 (Overbought): Suggests the stock has been bought too aggressively and might be due for a price correction or reversal downwards.
Below 30 (Oversold): Suggests the stock has been sold too aggressively and might be due for a price bounce or reversal upwards.
How it Works: The RSI uses a specific formula to calculate the average gains and losses over a set number of periods (usually 14).
2. Bollinger Bands
Purpose: Bollinger Bands are a volatility indicator. They consist of three lines: a simple moving average in the middle and two outer bands (upper and lower) that represent two standard deviations away from the middle moving average.
How it Works: The bands expand and contract with market volatility.
Narrow Bands: Indicate low volatility and often precede significant price moves.
Wide bands indicate high volatility.
Signals:
Price near Upper Band: Suggests the stock might be overbought relative to its recent average.
Price near Lower Band: Suggests the stock might be oversold relative to its recent average.
Price "hugging" a band can indicate a strong trend. If the price consistently rides the upper band, it suggests a strong uptrend.
3. Moving Average Convergence Divergence (MACD)
Purpose: The MACD is a momentum indicator that reveals changes in the strength, direction, momentum, and duration of a trend. It's particularly useful for identifying potential buy and sell signals.
Components: It consists of three parts:
MACD Line: (12-period EMA - 26-period EMA)
Signal Line: (9-period EMA of the MACD Line)
Histogram: (MACD Line - Signal Line), which visually represents the distance between the MACD and signal lines, indicating momentum.
Signals:
Bullish Crossover (Buy Signal): When the MACD line crosses above the signal line.
Bearish Crossover (Sell Signal): When the MACD line crosses below the signal line.
Divergence: When the price and MACD move in opposite directions, it can signal a weakening trend or potential reversal.
4. Stochastic Oscillator
Purpose: The Stochastic Oscillator is another momentum indicator that shows the location of the closing price relative to the high-low range over a set period. It's used to identify overbought and oversold conditions.
Range: It consists of two lines (%K and %D) that fluctuate between 0 and 100.
Signals:
Above 80 (Overbought): Indicates that the price is near the top of its recent range.
Below 20 (Oversold): Indicates that the price is near the bottom of its recent range.
Crossovers: When the %K line crosses above the %D line in the oversold region, it's a bullish signal. When it crosses below in the overbought region, it's a bearish signal.
Using Charts to Make Better Decisions: Combining Your Analysis
Reading stock charts isn't just about identifying individual patterns or indicators; it's about synthesizing this information to make well-rounded, informed trading decisions. This holistic approach is the essence of effective technical analysis.
Here’s how you can combine your knowledge:
Identify the Overall Trend First:
Use moving averages (e.g., 50-day and 200-day SMA) to determine if the stock is in an uptrend, downtrend, or sideways (ranging) trend.
Draw trendlines (connecting higher lows in an uptrend, lower highs in a downtrend). Always "trade with the trend" when starting out.
Confirm Patterns with Volume:
A head and shoulders pattern forming on low volume may not be as reliable as one confirmed by increasing volume on the breakout.
Similarly, a double bottom with increasing volume on the second bounce is a stronger signal. Volume acts as the confirmation bias.
Validate Signals with Multiple Technical Indicators:
Don't rely on a single indicator. If you see a bullish reversal pattern (like a double bottom), check if the RSI is rising from oversold territory or if the MACD is showing a bullish crossover. Multiple confirming signals increase the probability of a successful trade.
Practice Multiple Timeframe Analysis:
Look at charts across different timeframes (e.g., daily for the overall trend, hourly for entry/exit points). A stock might be in a long-term uptrend on the weekly chart but experiencing a short-term pullback on the daily chart, offering a potential buying opportunity.
Always Implement Risk Management:
Set Take-Profit Targets: Determine your desired profit level before entering a trade.
Use Stop-Loss Orders: This is non-negotiable. A stop-loss order automatically sells your position if the price falls to a predetermined level, limiting your potential losses. Never risk more than a small percentage of your capital (e.g., 1-2%) on any single trade.
Position Sizing: Determine how many shares to buy based on your risk tolerance and the distance to your stop-loss.
Common Mistakes to Avoid: Navigating the Pitfalls
While technical analysis offers incredible insights, trading with stock charts as a beginner comes with inherent challenges. Being aware of these common pitfalls can help you avoid costly mistakes and promote financial discipline.
Overanalyzing Data (Analysis Paralysis):
With so many chart patterns, technical indicators, and data points, it’s easy to become overwhelmed and fall into "analysis paralysis," leading to indecision.
Fix: Stick to a few reliable tools and focus on keeping your analysis simple and clear. Don't try to use every indicator on the chart.
Ignoring Risk Management:
Even if your chart analysis looks flawless, the market can still move against you unexpectedly. Failing to manage risk is the fastest way to lose money.
Fix: Always use stop-loss orders to define and minimize your potential losses on every trade. Determine your position size (how many shares to buy) based on your risk parameters, not just your capital.
Trading Based on FOMO (Fear of Missing Out) or FUD (Fear, Uncertainty, Doubt):
Emotional decisions driven by hype or panic are detrimental. Chasing a rapidly rising stock (FOMO) or selling out of fear (FUD) are common beginner mistakes.
Fix: Ensure every trade is based on your objective technical analysis and predefined trading strategy—not on emotion. Stick to your plan.
Not Backtesting Strategies (and Paper Trading):
Applying a strategy to live trades without prior testing is akin to gambling.
Fix: Before committing real capital, backtest your chosen strategy using historical data to see how it would have performed. Even better, paper trade (practice in a simulated environment with virtual money) to gain experience and confidence without risking real funds.
Ignoring the Fundamentals (for Investing):
While technical analysis focuses on price, fundamental analysis (company financials, industry trends, and management) provides context. For long-term investing, ignoring fundamentals is a mistake.
Fix: For long-term positions, combine your chart analysis with a basic understanding of the company's health and prospects.
Over-Leveraging:
Using too much borrowed money (margin) can amplify both gains and losses. As a beginner, this is extremely dangerous.
Fix: Avoid margin trading until you are highly experienced. Stick to using your own capital.
Start Trading Smarter Today: Your Journey to Confident Investing
Mastering the art of reading stock charts and chart patterns is a continuous journey that takes time, dedication, and consistent practice. However, it is undoubtedly one of the most important steps toward becoming a confident, disciplined, and potentially successful trader or investor.
By understanding the vital role of candlesticks and volume, recognizing basic yet powerful chart patterns, and skillfully utilizing key technical indicators, you'll be equipped to make more informed decisions, anticipate potential market movements, and significantly improve your risk management and trading strategies.
Take it slow, refine your skills through paper trading, continuously learn from both your successes and mistakes, and always stay updated on broader market trends. Remember, even seasoned traders were beginners once, and consistency in learning and disciplined execution is your best investment. The sooner you start practicing, the sooner you'll gain the visual fluency to navigate the fascinating world of financial markets.